This post may contain affiliate links. See my disclaimer for more information.
Welcome to the very first blog traffic and income report here at NMI!
I’m proud and happy to say that I made it through one whole month here, and I even got a handful of views! Woo hoo!
While I’m certainly a ways away from winning my first Finny© – a new personal finance blog award that I just made up – I’m still pretty happy with how this first month went, from my traffic stats, my ability to keep up on my writing, and continuing to improve my site.
I don’t have any income streams set up, but that’s not really the goal of this blog (and I imagine I wouldn’t make much money at all anyways, at least for now).
So let’s get to the stats here:
BLOG TRAFFIC
I don’t know why Google Analytics and Jetpack’s site stats differ so much, but Google’s is more impressive, so I’m going to go with theirs.
And by impressive, I mean that if my website traffic were somehow visually represented by a single image, it would look like this:

But here are the actual stats:
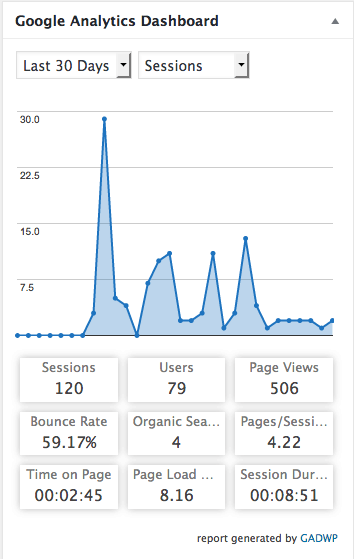
I actually don’t think this is too bad, overall, but let’s look at each category more closely.
You can look up the numbers behind a host of different stats, including Sessions, Users, Organic, Page Views, Bounce Rate, Locations, Pages, Referrers, Searches, Traffic, Technology and 404 Errors on Google Analytics. I won’t be going over all of these stats in detail, and some I won’t be covering at all. Do you really need to know how many users are looking at this glorious blog in 1920 x 1080 screen resolution as opposed to the number of people looking at it in 414 x 736? Wait, you do? Sweet! I know a new blog post someone’s getting for Christmas!
Note that some of the categories are broken down themselves into three other categories: Sessions, Users, and Page Views. I won’t be including all of that data either, as it goes into greater detail than most people need to know.
Session – All of the activities of a single user within a given period of time.
For example, one user may go to three different posts or pages and spend ten minutes on the blog in total, while another user may just visit one page and leave after thirty seconds. These would both be counted as sessions. My particular stats average out to about four sessions per day.
Users – The amount of times a unique device visited the site (e.g., a phone, computer, tablet, etc.)
Not too bad. While it’s not possible to know exactly how many unique people have visited here, as technically one person could be using two or more devices to look at the site, thus counting as two separate users, it does give one a rough idea how many different times people have come to your blog.
Page Views – The amount of views all of your pages/posts/etc. have generated.
I feel like that’s not a terrible number for the first month. I know many people get into the thousands, even high multiple thousands, but you have to be very active, both on the blog and on social media. I’m still getting used to doing both of those.
Bounce rate – The percentage of people who leave after landing on your site/page/post
Let’s say Duke the biker was browsing the Rockstar Finance directory and came across my newest blog post. He clicks on it and as he starts to read the mindless dribble he gets so infuriated that he immediately closes the page. This is counted as a bounce.
One of the limitations of tracking this stat is that Google doesn’t know if the person stayed on that “landing page”, as it’s called, for one minute or ten minutes. So if someone landed on your page, liked it and read it, but then had to close the page for some reason, but they wanted to come back later, it would still be counted as a bounce.
I think this bounce rate is actually quite reasonable for a new site. It shows that people aren’t bailing on it immediately after landing on one of my posts or pages, which is great!
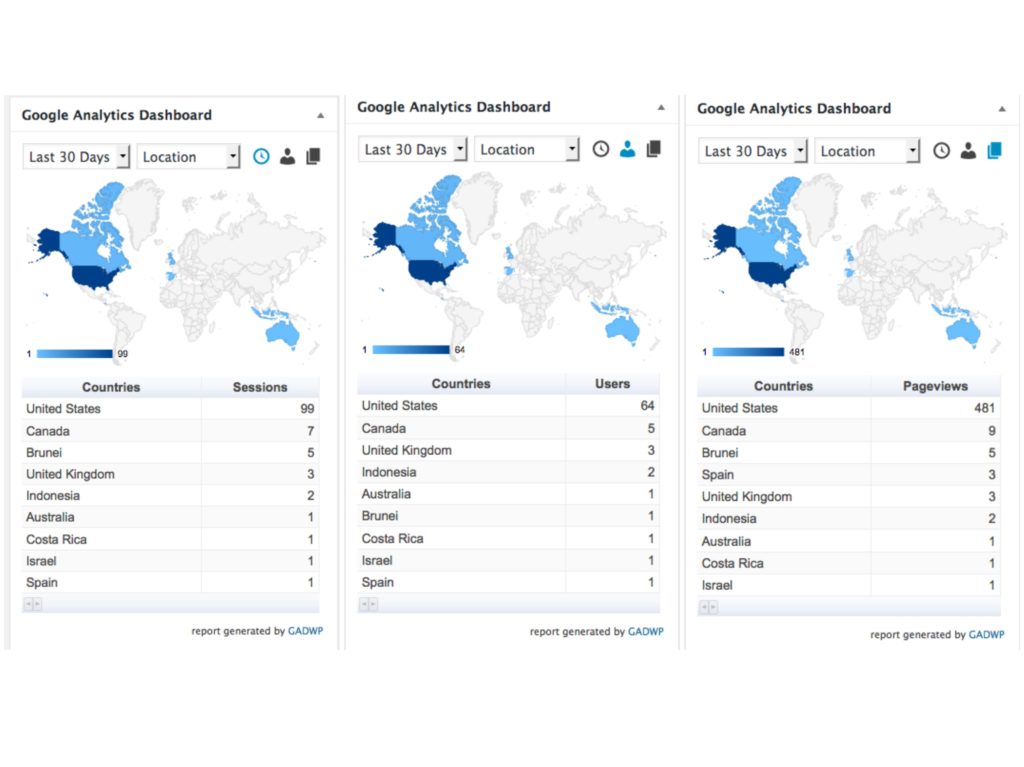
Location – Physical location of User
It’s pretty awesome when you see that people from not only other parts of the country, but all over the world, are reading your content. This last month was actually somewhat varied. While most of the views came from the United States, there were a couple of interesting outliers, like Brunei and Indonesia. Pretty cool. Here’s a picture of the tables that show Sessions, Users, and Page Views broken down based on location.
Pages
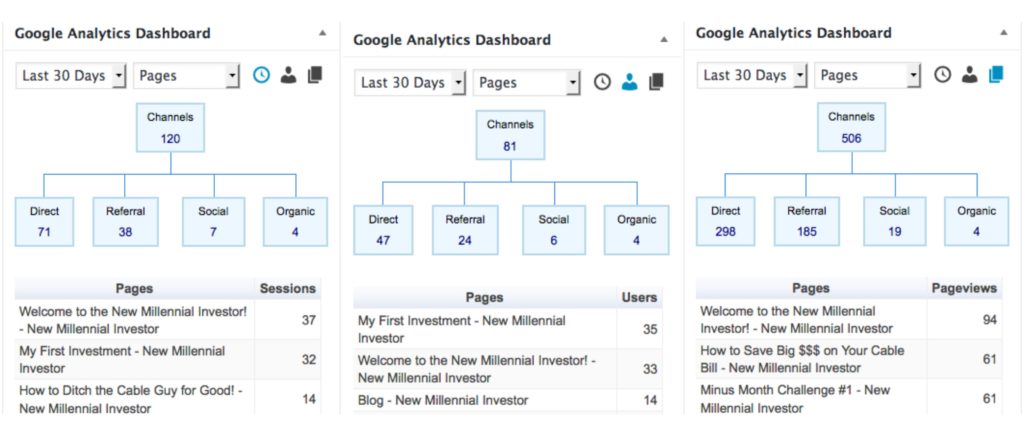
The site averaged about 4 page views per sessions, which I think is pretty good! Whether these users checked out a different blog post, the minus month challenge or some other page, the average person took a gander and bounced around a little, looking at multiple posts/pages/etc. Depending on whether we are looking at Sessions, Users, or Pages, the most popular pages/posts vary.
In general, the home page of NMI is the most popular, which isn’t surprising, as that’s generally the page most people land on. Interestingly, the top posts based on Sessions were “My Fist Investment” and the homepage, but according to Users and Pages, people liked the “Minus Month Challenge” and “How to Save Big $$$ on Your Cable Bill” quite a bit too.
Referrers – Where your traffic comes from
Most of my referrers came (and continues to come) from Rockstar Finance. If I hadn’t posted my blog information there, I don’t really know where I’d be getting traffic from. I’m not super involved with the community as of yet, but I’d like to be. I got some views from Twitter and a couple from JL Collin’s website as well (If you don’t know who I’m talking about, go to his site right now). I posted a nice comment to him, thanking him for all of his hard work and the effect his book and views had on me.
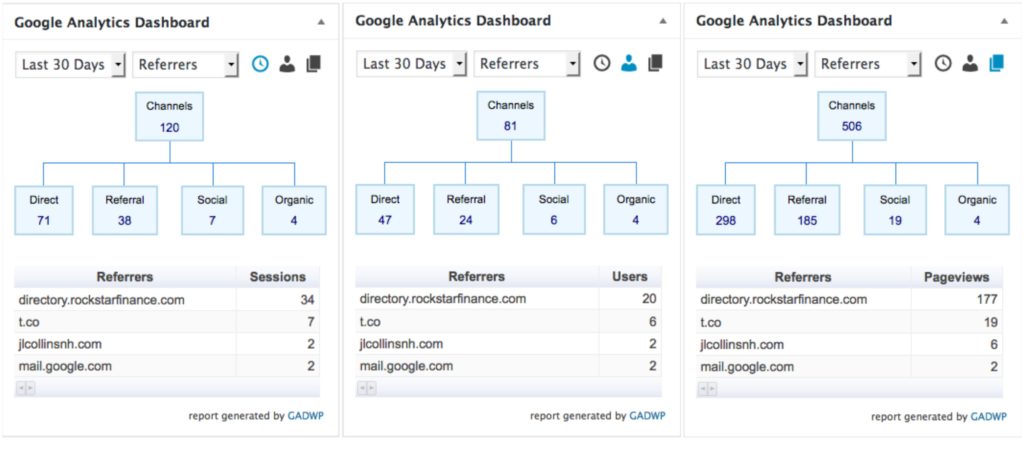
Traffic – Where your visitors are coming from
I’m just going to go over the Pages tab of the Traffic stat rather than Sessions, Users and Pages.
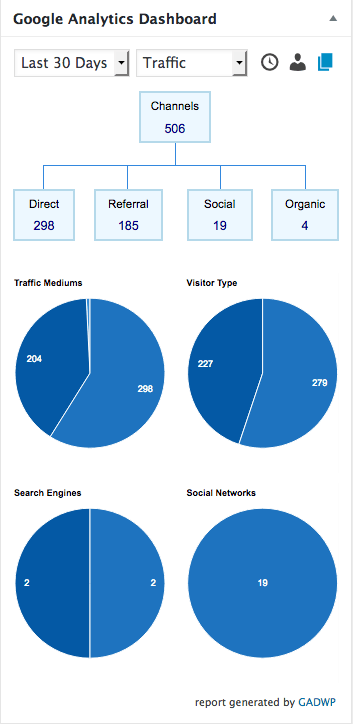
Traffic Mediums – I actually had more direct traffic than referrals, with 58.9% as opposed to 40.3% referral and 0.8% organic.
Visitor Type – I had slightly more returning visitors with 55.1% as opposed to the 44.9% new visitors.
Search Engines – Apparently I was searched for twice from both Google and Bing
Social Networks – And all off my traffic from social media came from Twitter
INCOME
Not surprisingly, I didn’t make any income from my blog this month (not that I was expecting to). In fact, I don’t know if this will ever become profitable – I’m not sure if that’s the direction I really want to go in. I don’t really want to cover the place with ads, nor do I wanna hawk some crappy product, but if there’s a way I could make a little income without sacrificing the quality of the site or compromising my beliefs then that’d be great.
Well, that wraps up the very first traffic and revenue report here at NMI! My numbers aren’t anything to write home about, so I’m not sure how often I’ll be doing these reports. Maybe I’ll do them once every few months or so. Hopefully I haven’t already jumped the shark…



Leave a Reply